Finding the optimal number of clusters (k) using Elbow Method
ClusteringBy CEO
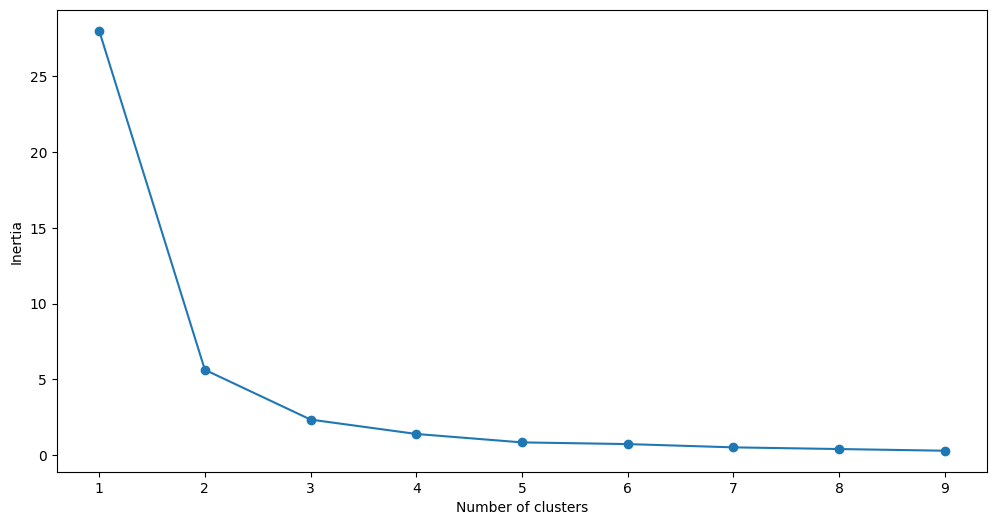
The elbow method is a technique used to find the optimal number of clusters (k) in a dataset for a clustering algorithm, such as k-means. The idea is to run the clustering algorithm for different values of k and plot the sum of squared distances (inertia) between data points and their assigned cluster centroids. The point where the rate of decrease in inertia sharply changes is considered the “elbow” of the curve, suggesting the optimal number of clusters.
Here are the steps involved in the elbow method:
Run the clustering algorithm for different values of k: Apply the clustering algorithm (e.g., k-means) to the dataset for a range of k values.
Compute the sum of squared distances (inertia): For each value of k, calculate the sum of squared distances between each data point and its assigned cluster centroid. This is often referred to as the “inertia” or “within-cluster sum of squares.”
Plot the results: Create a plot where the x-axis represents the number of clusters (k), and the y-axis represents the corresponding inertia values. The plot typically looks like an arm, and the “elbow” point is where the rate of decrease in inertia starts to slow down.
Identify the elbow point: The optimal number of clusters is often associated with the “elbow” of the curve, where adding more clusters does not significantly reduce the inertia. The elbow point represents a balance between having enough clusters to capture the data’s structure and avoiding overfitting.
Here’s a simple example using the elbow method with scikit-learn’s k-means and Matplotlib:
from sklearn.cluster import KMeans
from sklearn.preprocessing import StandardScaler
import numpy as np
import pandas as pd
import matplotlib.pyplot as plt
%matplotlib inline


data = np.array([[1, 2], [3, 4], [5, 6], [7,8], [9,10], [11, 12], [13,14], [15,16], [17,18], [19, 20],[1,3], [1,4], [1,5], [1, 6]])

# Instantiate the StandardScaler
scaler = StandardScaler()

# Fit and transform the data
data_scaled = scaler.fit_transform(data)

# fitting multiple k-means algorithms and storing the values in an empty list
sil_score= []
for cluster in range(1,10):
    model = KMeans(n_clusters = cluster, init='k-means++')
    model.fit(data_scaled)
    sil_score.append(model.inertia_)

# converting the results into a dataframe and plotting them
df = pd.DataFrame({'Cluster':range(1,10), 'SSE':sil_score})
plt.figure(figsize=(12,6))
plt.plot(df['Cluster'], df['SSE'], marker='o')
plt.xlabel('Number of clusters')
plt.ylabel('Inertia')
plt.show()
Looking at the above elbow curve, we can choose any number of clusters between 3 to 6.
Let’s set the number of clusters to 5 and fit the model:
# k means using 5 clusters and k-means++ initialization
kmeans = KMeans(n_clusters = 5, init='k-means++')
kmeans.fit(data_scaled)
pred = kmeans.predict(data_scaled)

# value count of points in each of the above-formed clusters
frame = pd.DataFrame(data_scaled)
frame['cluster'] = pred
frame['cluster'].value_counts()
1    6
3    2
0    2
2    2
4    2
Name: cluster, dtype: int64
In the resulting plot, the elbow point corresponds to the optimal number of clusters. Keep in mind that the elbow method is a heuristic, and the interpretation may not always be clear-cut, especially if the data does not exhibit a clear elbow. It is recommended to combine the elbow method with other evaluation metrics (e.g., silhouette score) for a more comprehensive analysis.